


for rent
121 Days on Strata
808 - 15 Richardson St
$2,300/mth
1 Bed + 1
1 Bath
0 Parking
665 SQFT
Price History
- Property Type:
- Condo
- Possession Date:
- TBD
- Lease Term:
- 1 Year
- Utilities Included:
- No
- Furnished:
- No
- Outdoor Space:
- Balcony
- Laundry:
- Ensuite
- Locker:
- None
- Exposure:
- East
Amenities
Indoor Parking
Gym
Concierge
Amenity details for reference only. Independently verify accuracy.
About this Listing
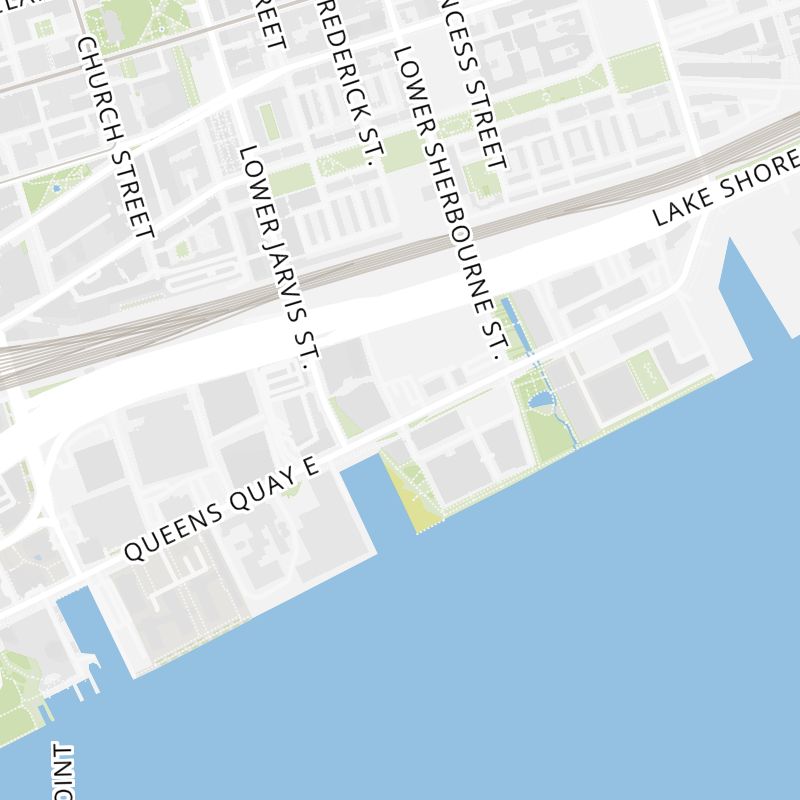
Welcome to this amazing 1-bedroom + den suite in a prime lakefront community. The spacious den doubles as a second bedroom or home office perfect for students or professionals. Steps from George Brown, Sugar Beach, Union Station and Scotiabank Arena. Transit and highway access make commuting easy. Enjoy top-tier amenities: fitness centre, party lounge, BBQ terrace, and a pet-friendly courtyard.
ExtrasStainless Steel Appliances: Fridge, Stove, Dishwasher, Washer/Dryer
re/max gold realty inc.MLS® #C12303668
Utilities & Inclusions
- Hydro
- Not Included
- Heat
- Included
- Air Conditioning
- Included
- Water
- Not Included
- Parking
- Not Included
- Building Maintenance
- Included
- Building Insurance
- Included
- Heating Type
- Forced Air
- Heat Source
- Gas
- Air Conditioning Type
- Central Air
Dimensions
- Bedroom
- 8.86 x 11.81ft
- Den
- 9.19 x 6.56ft
- Living
- 13.12 x 24.94ft
Renter's Market
Balanced
Landlord's Market
Building Spotlight
Similar Listings
Explore The Waterfront

Demographics
Based on the dissemination area as defined by Statistics Canada. A dissemination area contains, on average, approximately 200 – 400 households.
Population
17,591
Average Individual Income
$62,082
Average Household Size
3 persons
Average Age
45
Average Household Income
$105,756
Dominant Housing Type
Detached
Population By Age
Household Income
Housing Types & Tenancy
Detached
39%
High Rise Apartment
23%
Semi Detached
21%
Low Rise Apartment
9%
Duplex
4%
Marital Status
Commute
Languages (Primary Language)
Other
70%
Mandarin
13%
Cantonese
10%
Tagalog
2%
Tamil
2%
Arabic
1%
Spanish
1%
Armenian
1%
Education
University and Above
36%
High School
24%
None
16%
College
15%
Apprenticeship
3%
University Below Batchelor
3%
Major Field of Study
Business Management
26%
Architecture & Engineering
20%
Health & Related Fields
11%
Social Sciences
11%
Math & Computer Sciences
7%
Humanities
5%
Physical Sciences
5%
Education
4%
Visual & Performing Arts
3%
Personal, Protective & Transportation Services
2%
Building Trends At Empire Quay House
Days on Strata
Units at Empire Quay House spend an average of
N/A
Days on Strata
based on recent sales
List vs Selling Price
On average, these condos sell for
100%
of the list price.
Or in other words, the
Or in other words, the
entire list price
Offer Competition
Condos in this building have a
LOWchance of receiving
Multiple Offers
compared to other buildings in The Waterfront
Turnover of Units
On average, each unit is owned for
N/A
Property Value
0%
Increase in property value within the past twelve months
Price Ranking
N/A
Highest price per SQFT out of 45 condos in The Waterfront area
Sold Units
0
Units were Sold over the past twelve months
Rented Units
130
Units were Rented over the past twelve months
Best Value Rank
Empire Quay House offers the best value out of 45 condos in neighbourhood
?
N/A
Appreciation Rank
Empire Quay House has the highest ROI out of 45 condos in neighbourhood
?
N/A
Rental Yield
Empire Quay House yields the highest rent prices out of 45 condos in neighbourhood
?
N/A
High Demand
Empire Quay House is the most popular building out of 45 condos in neighbourhood
?
N/A
Market Insights
Transaction Insights at Empire Quay House
| Studio | 1 Bed | 1 Bed + Den | 2 Bed | 2 Bed + Den | 3 Bed | 3 Bed + Den | |
|---|---|---|---|---|---|---|---|
| Price Range | No Data | No Data | No Data | No Data | No Data | No Data | No Data |
| Avg. Cost Per Sqft | No Data | No Data | No Data | No Data | No Data | No Data | No Data |
| Price Range | $1,800 - $2,100 | $1,900 - $2,500 | $2,100 - $2,600 | $2,550 - $3,350 | No Data | $3,900 - $4,150 | No Data |
| Avg. Wait for Unit Availability | No Data | No Data | No Data | No Data | No Data | No Data | No Data |
| Avg. Wait for Unit Availability | 5 Days | 3 Days | 8 Days | 10 Days | No Data | 13 Days | No Data |
| Ratio of Units in Building | 21% | 45% | 12% | 15% | 2% | 8% | 1% |
Market Inventory
Total number of units listed and leased in Waterfront
